What Can 75,000 Pull Requests Tell?
Disclaimer: This is a cross post of the blog post I wrote on my company’s engineering blog. It is here for my own record. If you like the post and want to share it, you should share the original post.
Every last sprint of the quarter at Lyst is an innovation sprint. It varies between teams and individuals, but it can be anything from paying up some tech debt and trying out a new library or tool to building a prototype for a new idea. We chose to do an exploratory analysis of a large sample during the most recent innovation sprint, about 75K, pull requests (PRs), made between 2015 and 2021. This post covers the results.
Code review practices are a subject of continuous academic and industry research. Lyst has a significant amount of code review metadata available. Putting the two together makes it an interesting project to compare and see if there is anything eye-watering wrong (spoiler alert: there is not). Discussing this project with colleagues, we also came up with other interesting questions to be queried from the data.
Data Acquisition
The data acquisition was a two-step process. First, raw data was scraped from Github API using a small wrapper library ghapi and written out in a directory tree matching the API call paths. Second, a utility script was reading the raw data from the filesystem and inserting it into a single SQLite database file.
The two utility scripts are relatively simple. The main caveat for scraping Github API is to conform to the rate limits. It meant the process took longer, and I had to choose what to scrape first (users, teams, repos, and PRs) and what next (comments, reviews, file changes). Saving responses onto the file system made it easy to restart the process without re-scraping repeatedly.
The SQLite database was an excellent container for the data. Tools like datasette or Pandas read_sql function could be used to run and debug queries and extract exactly the data we needed for various plots.
Comparative Analysis
The comparative analysis builds on top of research about code reviews done by Google and Microsoft Research divisions in collaboration with researchers from universities. We tried to recreate and compare the majority of Rigby and Bird’s1 metrics about code review practices. Rigby and Bird analysed various projects in diverse industries and observed code review practices. Their primary conjecture is that if peer review practices have naturally settled to some common characteristics across a variety of different projects, such elements may indicate of practices that represent generally successful and efficient review methods. They called them convergent practices (CPs), defined as follows:
- CP1 - Contemporary peer review follows a lightweight, flexible process.
- CP2 - Reviews happen early (before a change is committed), quickly, and frequently.
- CP3 - Change sizes are small.
- CP4 - Two reviewers find an optimal number of defects.
- CP5 - Review has changed from a defect finding activity to a group problem-solving activity.
Another research we tried to recreate is based on the modern code review study done at Google2. This case study expressed the convergent practices through metrics derived from the code review metadata. In our analysis, we did the same. Yet, some metrics for Lyst were difficult to derive due to the insufficient granularity of data. Where possible - a less strict or wider-ranging metric definition was used. For example, the scraped data does not include information about resolved review comments, but “the number of comments per PR” is a looser definition, still indicative of how lightweight the code review process is.
Change Review Frequency (CP2)
One of the emergent practices is that code reviews happen early, quickly, and frequently (CP2). This can be quantified by the number of PRs opened per week per engineer.
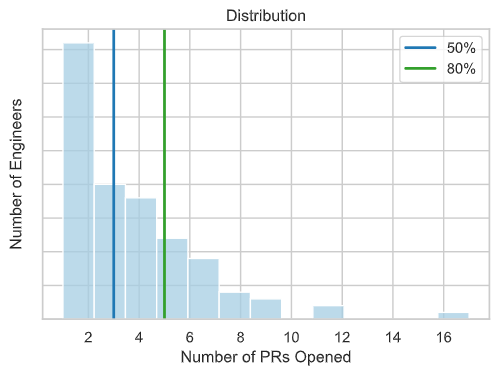
At Lyst, the median developer opens about 3 pull requests per week, and 80% of developers make up to 5 PRs per week. In comparison2, at Google, the median developer authors about 3 changes a week, and 80 percent of authors make up to 7 changes a week.
Next, the number of code reviews can be quantified. It is a pull request review approval/rejection submitted by a currently active user, except the PR author. A single pull request may contain more than one review from the same person, and they are counted individually.
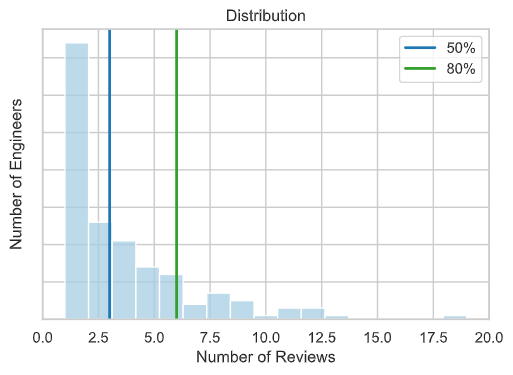
At Lyst, the median engineer reviews about 3 pull requests per week, with 80% of engineers reviewing up to 6 pull requests per week. In comparison2, the median for changes reviewed by developers per week at Google is 4, and 80 percent of reviewers review fewer than 10 changes a week.
Review Speed (CP2)
Bird, Carnaham, and Greiler, based on their experience building code review analytics platform3, define two metrics for code review speed - time to first response and time to completion. Time to first response is a measure of how much time passes between when the author submits a change for review and when the first comment or sign-off from a reviewer occurs. Time to completion is the time between when the author submits a change for review to when it has been marked as completed. At Lyst, similar metrics can be defined too. Time to first response - time between when a PR has been created and when the first review occurs. Review being a comment, request for changes, or approval. Time to completion is the time between when a PR has been created and when it has been merged.
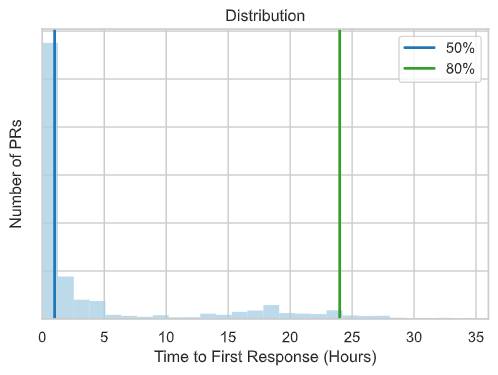
At Lyst, the median time to first response is within an hour, and 80% of PRs get their first review within 24 hours.
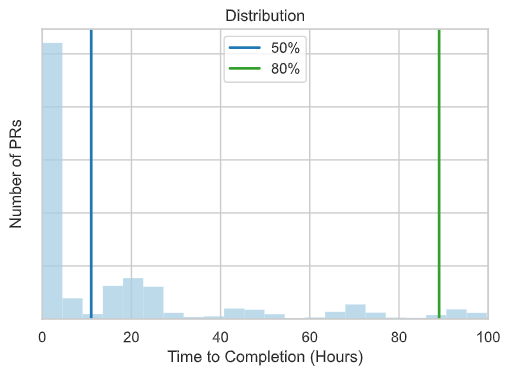
The time to completion at Lyst is 12 hours for 50% of pull requests, and 80% of pull requests get merged in 89 hours (or ~4 days).
At Google2, the overall (all code sizes) median latency for the entire review process is under 4 hours. This is significantly lower than the median time to approval reported by Rigby and Bird1 in other projects, which is 17.5 hours for AMD, 15.7 hours for Chrome OS, and 14.7, 19.8, and 18.9 hours for three Microsoft projects.
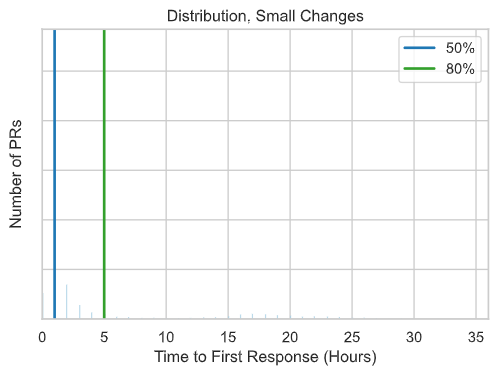
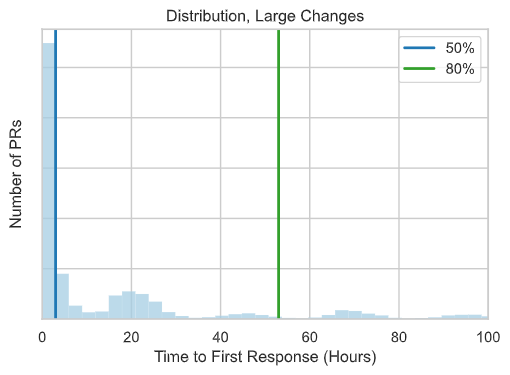
The Google case study further breaks down the time to first response based on the change size. The median time for small changes is under an hour and about 5 hours for very large changes. The research paper does not define what is a small or very large change. Therefore, we picked reasonably sounding numbers for what is a small or very large change at Lyst and tried to compare time to the first response.
Let’s say a small change at Lyst has the number of lines lower than the median size of 30 lines. The 80% (80th percentile) of all changes at Lyst are smaller than 175. This number can be used as a lower boundary for very large changes. With these definitions - the median to first response for small changes at Lyst is still within an hour, and for large ones - 3 hours.
Change Size (CP3)
The third convergent practice is that the changes submitted for code review are of some definition of small. The two most common3,1,2 measures are the number of files changed and the number of lines changed. Both can be extracted from the dataset used in this analysis.
NOTE: the research papers deviate from the 50th/80th percentile on this part of the analysis and therefore 10th, 35th, 50th, and 90th percentiles are used for comparison.
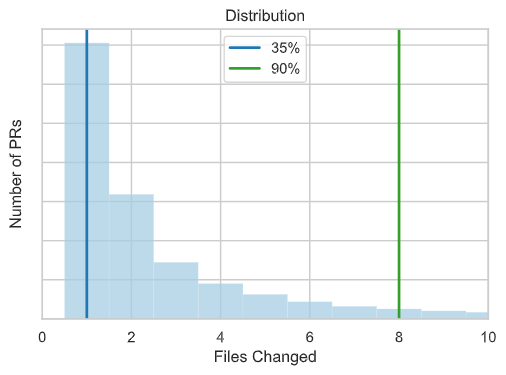
At Lyst, about 35% of pull requests modify a single file and about 90% modify fewer than 9 files. At Google2, over 35% of the changes under consideration modify only a single file and about 90% modify fewer than 10 files.
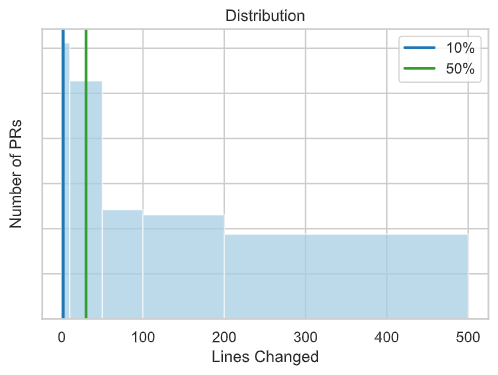
At Lyst, about 10% of pull requests modify two lines and the median number of lines modified is 30. This is very close to Google2, where 10% of changes modify only a single line of code, and the median number of lines modified is 24.
The median change size in both companies is significantly lower than reported by Rigby and Bird1 for companies such as AMD (44 lines), Lucent (263 lines), and Bing, Office, and SQL Server at Microsoft (somewhere between those numbers), but in line for change sizes in open source projects.
Number Of Reviewers (CP4)
Rigby and Bird1 investigated whether the considered projects converged to a similar number of involved reviewers. They found this number to be two. From the same research:
- At AMD, the median number of reviewers is 2.
- For Google Chrome and Android, there is a median of two reviewers.
- At Microsoft, the median number of reviewers invited to each review in Bing, Office, and SQL, respectively are 3, 3, and 4. The median number of people that take part in a review (other than the author) is 2.
Finally, at Google2, by contrast, fewer than 25% of changes have more than one reviewer, and over 90% have at most five reviewers with a median reviewer count of 1. Larger changes tend to have more reviewers on average. However, even very large changes on average require fewer than two reviewers.
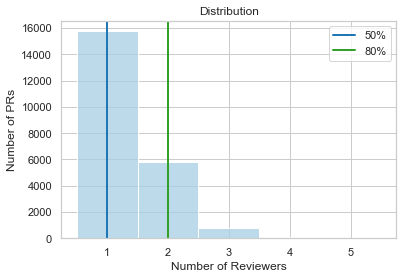
Lyst also converged to a median number of 1 reviewer, with 80% of pull requests having at most 2 reviewers who participated in a code review.
Knowledge Sharing (CP1, CP5)
One of the distinctively more interesting measurements defined by Rigby and Bird1 was the knowledge spreading effect of peer code review. They measured the number of files a developer has modified (submitted changes to), the number of files a developer has reviewed, and the total number of files they know about (submitted V reviewed). The number of distinct files edited and reviewed by engineers at Google2, and the union of those two sets, increase with seniority and the total number of files seen is larger than the number of files edited. The finding is that developers know about more files through the code review process.
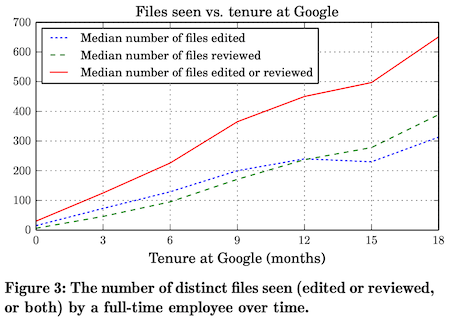
Bucketing active developers can derive a similar metric by how long they have been at Lyst (in 3-month increments) and then computing the number of files they have edited, reviewed, or both.
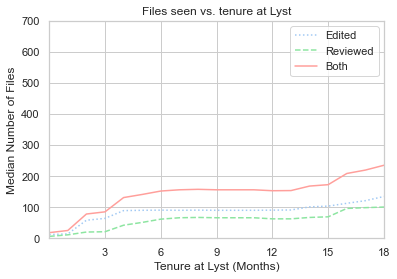
At Lyst, this graph is distinctly different from Google’s in a couple of ways. First, the median number of files is significantly lower. Second, the number of files plateaus for a year after the initial six months. Third, reviewed files never cross the edited files curve. It would be an interesting subject for further analysis to try and understand these differences.
Another aspect of the code review at Google is educational, and the case study2 tries to quantify this aspect by measuring the number of comments on their code changes. The study found that as developers build experience working at Google, the average number of comments on their changes decreases. They postulate that this decrease in commenting results from reviewers needing to ask fewer questions as they build familiarity with the codebase and corroborates the hypothesis that the educational aspect of code review may pay off over time.
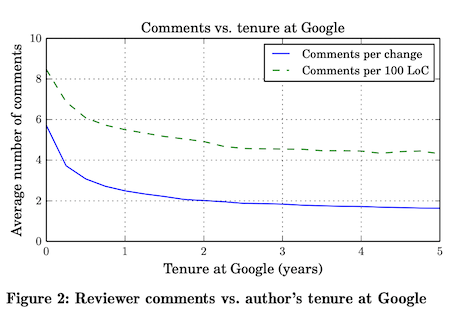
A similar metric can be derived for Lyst by considering only users who started after 2015.
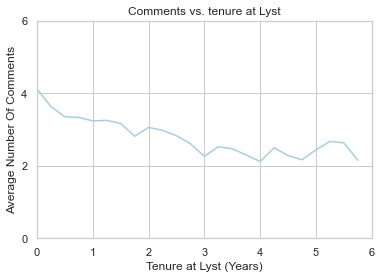
The resulting graph is similarly declining over time. It could be similarly postulated that as engineers at Lyst build familiarity with the codebase they need less guidance. There is one notable difference between the two, early on engineers at Google are receiving at least 2 more comments more on average.
Interesting Questions
This was probably the most interesting/exciting section to work on by far - to try to ask and answer a couple of questions specifically about Lyst. At the same time it probably is easiest to misinterpret, so a mandatory disclaimer:
The goal here is not necessarily to follow the statistical method in answering the question but instead to show some data. Therefore, it can be challenged that the answers suffer from a confirmation bias.
How long does it take for a new engineer to open their first pull request?
This is an interesting metric to look at from a developer onboarding perspective - is it too long? Lyst focuses the first days on setting up the accounts, meets and greets with the team, and giving new-joiners context before easing them into the first task.
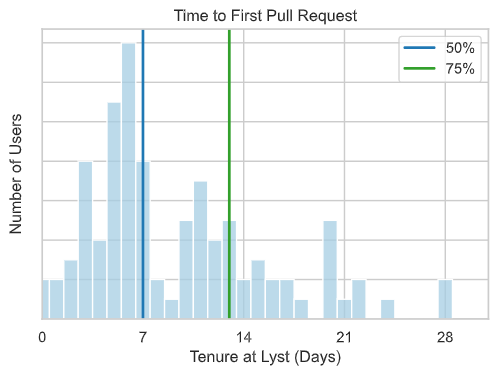
The above graph shows the time to first pull request from the time the Github user was created. One thing to note is that this account is usually created 3-5 days before the actual start date. So it can confidently be said that half of the engineers submit their first PR within the first week, and the majority (80%) do that within two weeks.
What is the median number of files in the first pull request?
From the comparative analysis section, we know that the median number of files changed is two. We could see whether there is something worth discussing about that first change. For example, if the first change most often is bigger than the median - maybe the entry-level tasks are big, maybe the new joiner needs some additional guidance and advice, maybe the projects could be improved, or - something else completely.
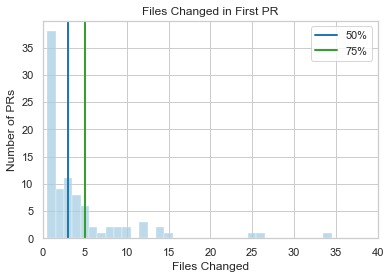
The median first pull request changes 2 files, just as the overall median.
What is the median number of lines of the first pull request?
From the comparative analysis section, we know that the median number of lines changed for pull requests at Lyst is 30.
While trying to answer this question it turned out the median number of lines in the first pull request is 51, which is higher by almost 2/3rds than the median for tenured engineers. So we split the data into small changes (less than 51 lines) and large changes (more than 51 lines). As expected, small changes are small. However, the average number of lines in the PRs classified as large was 858 lines.
We did not dig deeper, but it may be interesting to further investigate if this is a mistake in analysis or why about half of the newly joined engineers’ first changes are so big.
How many weeks does it take for an engineer to reach median and peak performance?
From the comparative analysis section, we know that the median number of PRs per week is 3, and the 80th percentile is 5 PRs. Let’s approximate the median performance as the number of weeks until a new engineer reaches 3 PRs per week. Similarly, peak performance, as the number of weeks before an engineer reaches 5 PRs per week.
This is a weak definition because it does not take into account continuity, e.g. someone making 3+ PRs just due to circumstance and then falling below that number. The answer should not be mixed up to productivity, as it also does not take many other aspects of productivity[5] into account.
Nonetheless, the answer could be indicative for planning purposes - how long until a newly joined engineer starts contributing as much as half or as most of the rest of the team.
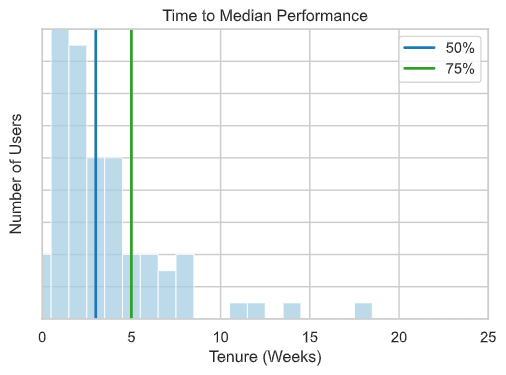
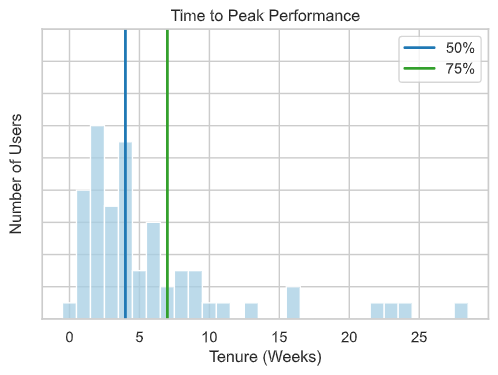
These graphs do not consider the fact that Github accounts are created about a week in advance. With that in mind, it takes between 2-4 weeks for the majority of engineers to reach median performance and between 3-6 weeks - to reach peak performance.
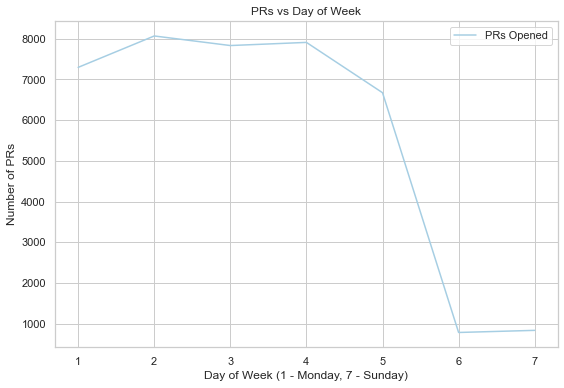
Which day of the week is the most active?
The days on which we are opening the most pull requests are roughly what could be expected - all days are equally productive, with slight undulations on Monday and Friday.
Similarly, we can look at a heatmap of time of day, per day of the week.
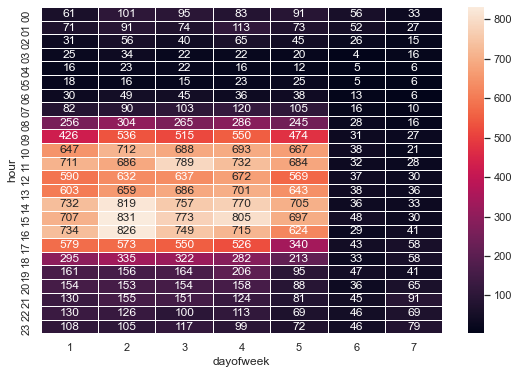
Again, nothing unexpected. Tuesday afternoon seems to have the most PRs opened. It’s worth noting not to make any massive conclusions from this heat map because it does not consider how long it took to make a pull request, just when it was opened. It also does not exclude any pull requests made by automated systems.
What impact to the number of pull requests opened did the first lockdown have?
This is another interesting metric to consider through the lens of the number of pull requests being opened 6 months before and 6 months after March 23rd, 2020.
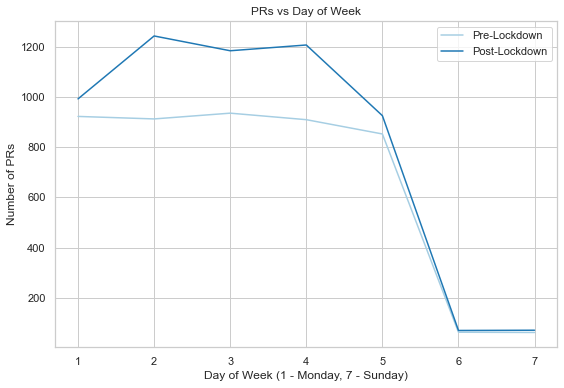
Drawing conclusions just from this graph is impossible - the contributing factors would require further analysis, maybe by looking at the data by isolating only the users active on March 23rd, to account for the team growth. Regardless of the reason, the difference is certain - ~33% higher rate of new pull requests post-lockdown.
Conclusions
It was an interesting project to compare Lyst code review metrics against available industry research and case studies. Unsurprisingly, code review practices at Lyst are on par with what other, large and prominent, technology companies practices converged to. The results also showed areas for further investigation. One thing is certain - this is just the tip of the iceberg. Analysis of data related to engineering has a lot of potential.
If you are data-driven too and interested in working with a great group of people on an amazing product, check out our careers page!
References
2013, Peter C. Rigby, Christian Bird Convergent Contemporary Software Peer Review Practices; Link ↩︎ ↩︎ ↩︎ ↩︎ ↩︎ ↩︎
2018, Caitlin Sadowski, Emma Soderberg, Luke Church, Michal Sipko, Alberto Bacchelli, Modern Code Review: A Case Study at Google; Link ↩︎ ↩︎ ↩︎ ↩︎ ↩︎ ↩︎ ↩︎ ↩︎ ↩︎ ↩︎
2015, Christian Bird, Trevor Carnahan, Michaela Greiler, Lessons Learned from Building and Deploying a Code Review Analytics Platform; Link ↩︎ ↩︎